What really tells you your event app is working?
Data isn’t just a post-event formality—it’s the heartbeat of your attendee experience. If you’re using a conference app builder, you’re sitting on powerful analytics that go far beyond download counts. Understanding those numbers can reveal what your audience values most, when engagement spikes, and where your event ROI truly lives.
At Yapp, we’ve seen organizations transform their events simply by tracking the right metrics. When Uncubed switched to Yapp, their team slashed $100,000 in costs and boosted engagement across 5,000+ attendees. Those wins weren’t luck—they were data-driven decisions powered by app insights.
So, which event app metrics really matter? Let’s break down the six that should guide every planner’s strategy.
Which engagement metrics drive real insight?
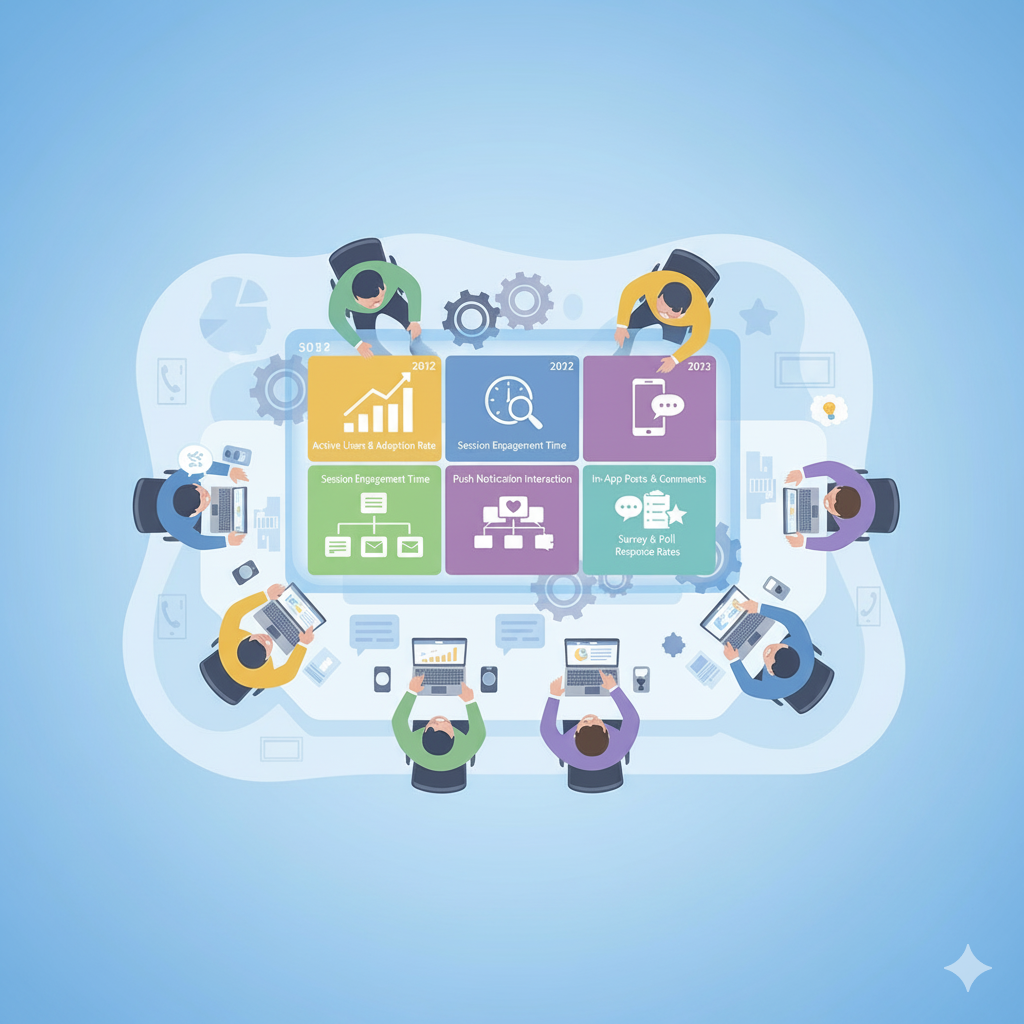
Not all metrics are created equal. Some are vanity stats; others are actionable indicators of success. Here are the six event app KPIs that deserve your attention:
- Active Users and Adoption Rate
Track how many attendees not only download but actively use your app. A healthy adoption rate (60%+) signals that your communication strategy and app content are hitting the mark. - Session Engagement Time
The longer users stay in your app, the more value they’re finding. Look at average time per session and repeat visits to identify your strongest features—agenda views, polls, or live chat. - Push Notification Interaction
Measure open rates and clicks on notifications. Frequent engagement means your updates are relevant and well-timed. Schools That Can used unlimited push notifications during their National Forum and saw 96% attendee satisfaction with event logistics. - Page Views per User
If attendees are exploring multiple sections (speakers, sponsors, schedule), it’s a sign your layout is intuitive. Pages with low engagement may need clearer design or richer content. - In-App Posts and Comments
Real-time conversations show true community energy. High engagement on social walls or discussion tabs reflects how well your event fosters connection. - Survey and Poll Response Rates
Post-session feedback tells you what resonated. High participation equals trust—attendees know their input shapes future experiences.
How do you turn metrics into better events?
Here’s how to turn numbers into next-level decisions that improve future events:
- Compare pre-event, live, and post-event engagement. Notice where participation drops and boost communications before those lulls.
- Segment your audience analytics. Sponsors, speakers, and attendees often engage differently—use that insight to tailor messaging.
- Track cost vs. engagement. Yapp’s Uncubed case proves digital updates beat print materials, saving money and increasing impact.
- Use data for sponsor ROI. Show potential partners how attendees viewed their content or clicked sponsor pages.
- Automate feedback loops. Sync post-event survey results directly with future planning tools to shorten your iteration cycle.
When Verizon rolled out internal event apps through Yapp, they grew from two apps a year to nearly eight—saving 10% annually and fueling consistent employee engagement. The secret? They paid attention to usage data and doubled down on what worked.
From our own Yapp analytics team, one of us put it best:
“You can’t manage what you don’t measure. Every push, page view, and post tells you where the energy of your event lives—and how to amplify it.”
Why data-led events outperform the rest
Metrics aren’t just for the recap deck. They’re the foundation of smarter, more human experiences. With Yapp, you don’t need a data scientist to understand what works—you just need to track consistently and act quickly.
Here’s how our own team approaches it:
“We look for patterns in engagement spikes. When an organizer’s notifications outperform others, we ask why—and then we share those best practices.”
Data lets you pivot mid-event, not just plan for the next one. Whether you’re using a conference app builder for a 500-person summit or a hybrid training, your analytics can spotlight your strengths and pinpoint gaps before attendees even notice them.
The best events today aren’t just memorable—they’re measurable. Every swipe, click, and push notification adds up to a clear picture of what your audience values. And when you can see that clearly, you’re not guessing—you’re designing experiences that feel personal, seamless, and worth coming back to. That’s what separates great event planners from good ones.
But here’s the real unlock: when teams start treating analytics as part of the creative process, not the cleanup process, events evolve. They get sharper. Faster. More aligned with what attendees crave. Our product team often says, “The data tells the story, but creativity writes the next chapter.” That blend of art and insight is where the magic happens.
And as London Screenwriters’ Festival showed, agility backed by data turns challenges into wins. When their live event went virtual, real-time insights helped the small team coordinate 100 sessions for over 1,000 attendees—without missing a beat.
So don’t just collect numbers. Let them tell your event’s story, one interaction at a time.
Ready to make your next event better? Start your trial now!


